Celebrating Fifty Years of SEER
, by Elise Tookmanian, Ph.D.
In 2023, the NCI SEER Program celebrates its 50th anniversary. DCEG is grateful for this incredible NCI resource which underpins nearly everything we do. Data from SEER are central to the day-to-day work of researchers in DCEG.
An Invaluable Descriptive Epidemiology Resource
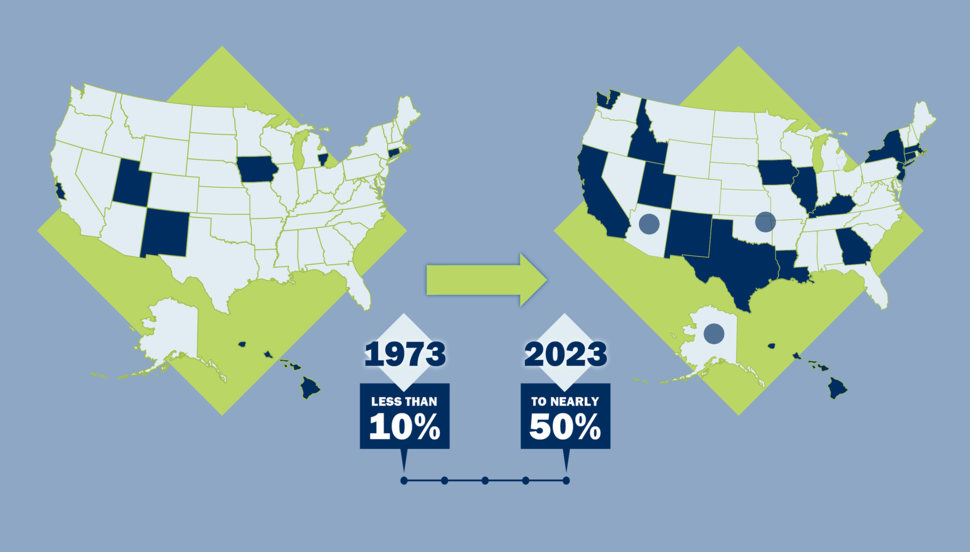
SEER registry coverage from 1973-2023.
The Surveillance, Epidemiology, and End Results (SEER) Program data are critical to understanding cancer in the U.S. SEER is a collection of cancer registries, which collect, store, and manage data on people with cancer. Before 1973, only a few registries existed in the U.S. Supported by the 1971 National Cancer Act, SEER launched with registries in five states and two metropolitan areas that encompassed less than ten percent of the U.S. population. Fifty years later, the program has expanded to 18 registries, representing nearly 50 percent of the U.S. population.
In the absence of a nation-wide registry, the SEER Program provides a population-based approach to explore patterns and trends in cancer incidence and outcomes through comparisons across groups, places, and/or time. These data present a big picture view and allow investigators to generate new hypotheses and research questions.
“I think of descriptive epidemiology as the beginning and the end of our work in DCEG,” said Meredith Shiels, Ph.D., M.H.S., senior investigator in the Infections and Immunoepidemiology Branch. “At the beginning, we’re looking for clues to better understand cancer etiology, and at the end, we want to know if interventions are having an impact at the population level.” SEER enables these studies.
Investigators in the Radiation Epidemiology Branch (REB) and the Cancer Survivorship Research Unit (CSRU) use SEER data to quantify outcomes in cancer survivors as a standard part of the research process. “Leveraging the strengths of the SEER Program, particularly the large sample size, enables us to discover meaningful patterns in cancer survivors and helps identify priorities for future research,” said Lindsay M. Morton, Ph.D., Branch Director, Head of CSRU, and senior investigator in REB. “Descriptive studies can help us understand when we should launch a more detailed investigation of risk factors.” With over 18 million cancer survivors in the U.S. today, SEER data are especially critical to investigations of second cancers and survivorship.
Similar opportunities arise for rare cancers. “We’re studying a rare type of non-Hodgkin lymphoma called primary effusion lymphoma (PEL). It’s hard to get data for PEL, but using SEER, we can begin to look at patterns, and that’s been very informative,” said Eric A. Engels, M.D., M.P.H., Branch Director and senior investigator, IIB.
SEER also includes demographic data. “You can look at cancer rates by racial or ethnic group or link to county level metrics of socioeconomic status or degree of rurality,” said Dr. Shiels. “These data can highlight differences that show a need for more detailed studies to identify the underlying causes of these health disparities.” A recent example of a DCEG study using this approach is a study published by REB Assistant Clinical Investigator Jacqueline Vo, Ph.D., R.N., M.P.H., on geographic disparities in mortality from cardiovascular disease among breast cancer survivors.
Racial and ethnic demographic data available in SEER has evolved with the U.S. census to allow individuals to self-identify with greater detail. This advance has enabled researchers to disaggregate racial and ethnic groups further, such as a recent study from Maria Constanza Camargo, Ph.D., Earl Stadtman investigator in the Metabolic Epidemiology Branch, which studied esophageal and gastric cancer mortality in the more specific categories of Asian and Pacific Islander ancestry.
Evolving with Scientific Advances
“From its inception in the early 1970s, SEER has been ahead of the curve. They have prioritized data quality control and built a reputation as a trusted data source,” said Philip S. Rosenberg, Ph.D., senior investigator in the Biostatistics Branch. To be included in SEER, registries must maintain an excellent cancer reporting system and consistently meet data quality goals. Quality refers to the timeliness and completeness of data reporting, but also the variables that are collected. Fifty years of SEER data gives unique insights into trends over time, but with advances in cancer research, meaningful new variables emerge.
Advances in molecular characterization of tumors redefined classification of subtypes for many types of cancer. In addition to the opportunities for targeted therapies, differentiated data by tumor subtype can uncover etiologic differences. SEER has expanded to include characteristics like hormone receptor status in breast cancer and detailed histologic subtypes for hematologic malignancies. For example, in 2001, the World Health Organization (WHO) released new classifications for lymphoma subtypes integrating the perspectives of clinicians, pathologists, and molecular biologists, but implementation of the new classifications into epidemiologic research lagged. Six years later, Dr. Morton, at the time a postdoctoral fellow, was serving on the International Lymphoma Epidemiology Consortium (InterLymph) Pathology Working Group, which led the creation of a nested classification system for epidemiologic research based on the WHO scheme, alongside translations to past classification systems. “I was excited that SEER facilitated epidemiologic research on lymphoma by including this classification in the standardized SEER variables, and I am impressed by SEER’s ongoing dedication to incorporating changes in disease classification,” said Dr. Morton. Recoding historical data based on new insights is a delicate process. Fortunately, “SEER’s foundation of scientifically rigorous data dictionaries allows us to update current trends in a historical context,” said Dr. Rosenberg. For example, the SEER incidence data for hematologic malignancies are classified using both the historical classification and the new, more specialized system.
Beyond adding new variables collected, SEER data can be enriched through linkages with other data sources. “A significant development was the linkage with the Medicare claims database,” said Katherine A. McGlynn, Ph.D., M.P.H., senior investigator in MEB. SEER-Medicare links healthcare claims and cancer data for people enrolled in Medicare. “With the claims data, we could evaluate preexisting medical conditions that might be associated with cancer. This was particularly important for my studies on liver cancer, since it is a malignancy that occurs among people in their 60s and 70s.”
Analyzing SEER Data

Meredith Shiels and postdoctoral fellow Jennifer McGee-Avila look at data on a laptop.
SEER has also evolved with technology. When the program began, computers were a relatively new tool. Today, the data are easily accessible online and can be downloaded with a simple user agreement. The software package SEER*Stat makes initial analysis of the immense data relatively straightforward; since its inception, DCEG scientists have been involved in its ongoing development and improvement.
One example of this collaboration is the NCI Second Cancers Monograph, led by Rochelle E. Curtis, M.A., staff scientist in REB. The Monograph was a critical contribution to our understanding of second cancers and the first to provide a comprehensive analysis of the risk of developing subsequent malignancies in the U.S. population. Following this analysis, she worked closely with SEER to develop a module of SEER*Stat for analysis of second cancers, called multiple primary standardized incidence ratio (MP-SIR). In this module, a cohort of cancer survivors are followed through time in order to compare their cancer incidence rate with the incidence rate for the general population.
However, outside of SEER*Stat the analyses can quickly become more complicated. “Even for a single cancer, we necessarily need to carry out a multivariate analysis,” said Dr. Rosenberg. “This has spurred my interest in software tools and methodological research on foundational methods for cancer surveillance research.” One example is the Age Period Cohort (APC) Analysis Web Tool, which was created specifically to make this important type of analysis more accessible to researchers. “APC allows researchers to disentangle how changes in incidence by age vary according to factors associated with birth cohort versus calendar period,” said Dr. Rosenberg. Age effects may indicate that the etiology of the cancer is related to aging, while birth cohort effects are generational, potentially related to collective lifestyle changes. Period effects are temporal trends, likely relating to a specific event, such as the introduction of a new carcinogenic exposure.
Within the APC approach, Dr. Rosenberg invented “Local Drifts,” an analysis that quantifies how yearly changes in cancer rates vary by age. “Local Drifts helped us establish that early-onset colorectal cancer incidence in the U.S. has been increasing over time, one of our most important discoveries,” said Dr. Rosenberg.
This work benefits the entire scientific community but is especially helpful to the epidemiologists who work just down the hall. “I think one big advantage of using SEER data in DCEG is having such a wonderful Biostatistics Branch with whom to collaborate,” said Dr. McGlynn, whose research has relied on APC analysis for critical findings.
What the Future Holds – Only SEER Can Tell
Over the last fifty years, SEER has evolved with science and technology, becoming a better research resource with each advance. With its long-held commitment to progress, the future for SEER and the researchers who use it is bright.
One opportunity for the future is to expand the collection of tumor samples for analysis, including genetic sequencing. “Three SEER registries have tumor retrieval programs, which can be a great resource for research,” said Dr. Engels. “The ability to look at tumor sequencing data or staining of different proteins involved in the development of cancer can help accelerate our understanding of cancer etiology.”
No matter how SEER moves forward, perhaps expanding the number of registries, increasing the variables collected, or facilitating connections to more data sources, our understanding of cancer in the U.S. will continue to be enriched because of SEER’s efforts. DCEG researchers are excited to use SEER for the next half century.