Background
The HIV/AIDS Cancer Match (HACM) Study is an observational, registry-based cohort of over 850,000 people with HIV (PWH) across large regions of the United States followed since the widespread introduction of effective antiretroviral therapy in 1996 through the present time.1-3 This large, population-based study was created to fill knowledge gaps in the epidemiology of malignancies among PWH. The HACM Study has made important contributions to public health, including characterizing trends in cancer risk over the course of the entire HIV epidemic,4-6 understanding shifts in the projected cancer burden among aging populations on long-term antiretroviral therapy,7, 8 and describing disparities in treatment and outcomes following a cancer diagnosis.9, 10
The HACM Study is a long-standing collaboration between the National Cancer Institute (NCI) and U.S. state health departments. The study design uses public health surveillance information on HIV and cancer, both of which are notifiable conditions to health departments. Confidential name-based case reporting is conducted during routine surveillance activities by local, state and territorial health departments in each jurisdiction, and case reports are compiled into disease-specific registries. Through collaborations with regional health departments, the HACM Study merges these disease-specific registries to construct a novel data resource with which to conduct epidemiologic investigations. Each registry linkage is conducted by the regional health department. All personally identifying information is removed from analytic files used by researchers at the NCI.
HIV registries provide information on demographic characteristics, HIV transmission risk groups, AIDS diagnoses, laboratory markers of immune status (CD4 count and HIV viral load), and mortality. Cancer cases are ascertained through data linkage with population-based cancer registries. Cancer registries provide information on demographic characteristics of cancer patients, tumor features, first course cancer treatment in broad categories, and mortality.
Purpose of this Report
The purpose of this report is to describe the HACM Study design and review some common data limitations and statistical challenges when using real-world data. This report describes the processes for evaluating the quality of matched data, the design of analytic HIV cohorts, and the primary statistical considerations when using HACM data.
Methods and Results
Investigators in the Infections and Immunoepidemiology Branch, National Cancer Institute reviewed data sources and methods, and identified the most common statistical considerations that were encountered during the design of epidemiologic studies that utilize the HACM data. The authors reviewed prior methodologic publications and internal best practice guidelines for research design and analysis in the HACM Study. Topics were then organized into two themes: Part 1 describes HACM Study data sources and linkage methodology. Part 2 discusses statistical considerations encountered in the most common HACM Study designs.
Part 1. Standard procedures for data matching
Registry data sources
The HACM Study links population-based cancer registries to HIV surveillance data across 14 states and other regions of the United States. HIV registries provide information on PWH with respect to demographic characteristics, HIV transmission risk groups, AIDS diagnoses, laboratory markers of immune status (CD4 count and HIV viral load), and mortality. Cancer registries provide information on demographic characteristics of cancer patients, tumor features, first course cancer treatment in broad categories, and mortality.
Data linkages in the HACM Study are conducted by local registry staff and use probabilistic matching algorithms from commercially available software (e.g., Match*Pro). In each region, personal identifiers, including but not limited to, first and last name, date of birth, and social security number, are used to match person-level cancer data to HIV surveillance data. Changes in patient identifiers used to link registry records may arise due to changes in civil status and last name, change in residence over time, the use of aliases, and data entry errors. In contrast to deterministic matching, which relies on the exact matching of on identifying variables, probabilistic methods can handle these minor discrepancies. Probabilistic approaches use a combination of identifiers to construct a weight corresponding to the likelihood that a given pair of records are a true match. A high weight indicates a high degree of similarity between a pair of records, and a low weight indicates dissimilarity. Records with the highest weights above a predetermined threshold are categorized as definite matches, while potential matches in an intermediate range of weights require clerical review by the health department. After the match is completed, all personal identifiers are removed from the analysis files before they are transmitted to the NCI via a secure file transfer protocol. Institutional Review Board approval was obtained for each region, if required, prior to commencing the study.
The design of etiologic studies requires thoughtful consideration of inclusion criteria for the study populations and calendar trends in state reporting requirements. Data specifications for each registry vary according to the years of overlapping coverage of name-based HIV registration and complete ascertainment of cancer cases by regional health departments (Figure 1). Cancer registration was federally mandated in 1973, and regional expansion of cancer registries was further enhanced through additional funding and technical assistance initiatives by the National Program of Cancer Registries (NPCR) in 1994. As of 2020, the Surveillance, Epidemiology, and End Results (SEER) Program of the National Cancer Institute includes cancer data from population-based registries covering 48% of the United States population. SEER is considered an authoritative source of information on cancer incidence and survival in the United States. The HACM Study includes cancer registries supported by SEER and NPCR. Federal requirements for name-based reporting of all HIV cases began in 2001, although many regions commenced name-based HIV reporting prior to 2001. Some regions used coded patient identifiers before that time, but these coded identifiers cannot be used for matching. By April 2008, all jurisdictions implemented name-based HIV surveillance.11
As a result of the heterogeneous start dates for name-based HIV and complete cancer reporting, the period of overlapping surveillance coverage for both diseases varies according to jurisdiction (Table 1and Figure 1). The HACM Study period for each jurisdiction reflects the temporal overlap of registry data sources. Due to a two-year lag in complete cancer reporting, the latest year of complete cancer registry data typically occurs two years prior to the data matching. For example, the Colorado data linkage was run in 2017 and incorporated complete cancer data through 2015 (Table 1).
| State/Region | Start of HIV name-based registration | Start of complete cancer registry data | Latest year of cancer registry data | HIV/AIDS Cancer Match Study Period |
|---|---|---|---|---|
| Colorado | 1986 | 1998 | 2015 | 1998–2015 |
| Connecticut | 2002 | 1973 | 2016 | 2002–2016 |
| District of Columbia | 2007 | 1996 | 2015 | 2007–2015 |
| Florida | 1997 | 1979 | 2019 | 1997–2019 |
| Georgia | 2004 | 2004 | 2012 | 2004–2012 |
| Louisiana | 1993 | 1988 | 2015 | 1996–2015 |
| Maryland | 2008 | 1996 | 2018 | 2008–2018 |
| Massachusetts | 2007 | 1982 | 2016 | 2007–2016 |
| Michigan | 1992 | 1996 | 2015 | 1996–2015 |
| New Jersey | 1992 | 1979 | 2012 | 1996–2012 |
| New York | 2001 | 1996 | 2019 | 2001–2019 |
| North Carolina | 1990 | 1996 | 2014 | 1996–2014 |
| Puerto Rico | 2003 | 1997 | 2017 | 2003–2017 |
| Texas | 1999 | 1999 | 2019 | 1999–2019 |
Figure 1.
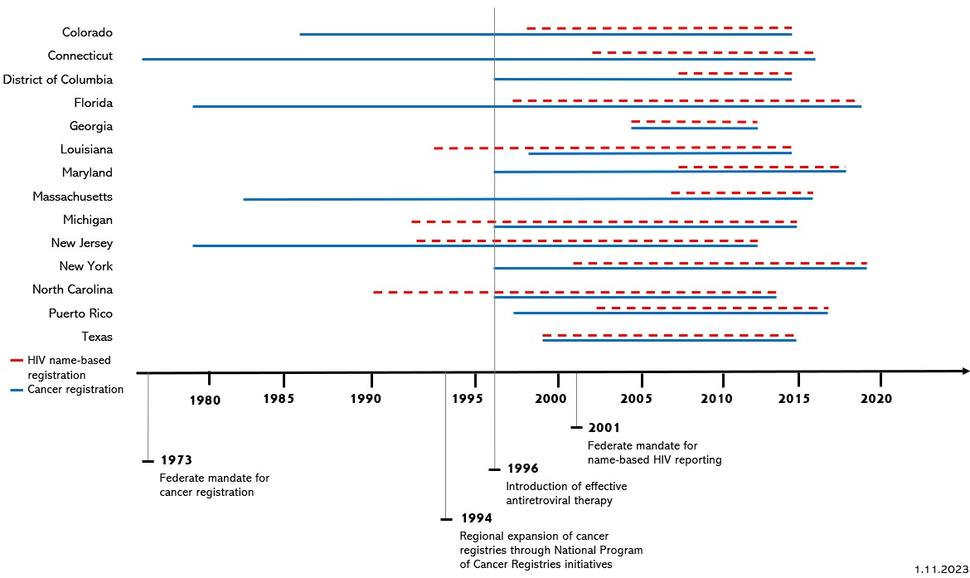
Figure 1. Coverage of HIV and cancer registries in the HACM Study, in relation to key dates in HIV and cancer surveillance.
Figure 1 includes the information from Table 1 (years of coverage for cancer registration and name-based HIV registration by HACM study regions), overlayed by key dates in HIV and cancer surveillance. In the chart, red dotted lines denote HIV name-based registration. Blue solid lines denote cancer registration. Key dates include:
1973 – Federal mandate for cancer registration.
1994 – Regional expansion of cancer registries through National Program of Cancer Registries Initiative.
1996 – Introduction of effective antiretroviral therapy.
2001 – Federal mandate for name-based HIV reporting.
HIV registry information
Local and federal health agencies use confidential name-based HIV reporting to monitor trends in HIV incidence, stage of HIV disease, retention in care, and health outcomes like viral suppression and survival. All jurisdictions now use the CDC-developed Enhanced HIV/AIDS Reporting System (eHARS) to collect, monitor, and report HIV data to the CDC. Laboratory information on CD4 cell counts and viral load counts from diverse clinical, laboratory, and hospital sources are used to find new HIV cases and monitor disease progression for existing cases.
A challenge in using surveillance laboratory data for epidemiologic research is that jurisdictions use different cutoff levels for reportable values, and reporting thresholds have varied over time because of changes in state legislation. Among HACM Study sites, for example, several registries historically captured only CD4 cell counts <200 cells/mm3 (used to capture progression to AIDS). In more recent years, registries consider any value of CD4 count as reportable. In addition, many HIV registries did not routinely collect undetectable viral loads, although that information is now available in more recent data for most HACM Study sites. Information on receipt of antiretroviral therapy is not available in HIV registries and has not been provided to the HACM Study, although state public assistance programs may have this information separately. Table 2 summarizes the years of compete laboratory reporting by registry. For example, although Colorado HIV reporting started in 1998 (Table 1), it was not until 2011 that all values of CD4 counts were collected and the capture was considered complete from various sources across the entire state.
| Registry | Year of first complete viral load reporting | Year of first complete CD4 cell count reporting |
|---|---|---|
| Colorado | 2011 | 2011 |
| Connecticut | 2014 | 2008 |
| District of Columbia | 2010 | 2009 |
| Florida | 2011 | 2011 |
| Georgia | 2008 | 2010 |
| Louisiana | 2009 | 2009 |
| Maryland | 2012 | 2012 |
| Massachusetts | 2012 | 2016 |
| Michigan | 2005 | 2007 |
| New Jersey | 2008 | 2007 |
| New York | 2005 | 2008 |
| North Carolina | 2013 | 2009 |
| Puerto Rico | 2013 | 2014 |
| Texas | 2010 | 2010 |
Note: The first year of complete viral load reporting is determined as the first year when at least 50% of viral load measurements were undetectable and the number of results was at least 50% of the total in the peak year (i.e., year with the greatest number of measurements). The first year of complete CD4 cell count reporting is determined as the first year when at least 50% of CD4 counts were above 200 cells/mm3 and the number of results was at least 50% of the total in the peak year.
In addition, a person is not actually known to have HIV infection until they are reported to the HIV registry. The HIV report date is the date the person was reported to the health department as having HIV, based on the eHARS system date when the HIV case definition category for the person is indicated as “definitive.” Evaluating follow-up time before the HIV report date poses a concern with respect to immortal time bias. For these reasons, the HACM Study uses HIV report date rather than HIV diagnosis date as a start time for calculations of cancer incidence, as described in the section Follow-up time for cancer incidence.
Cancer registry information
Cancer registry data are collected from diverse sources, including hospitals, outpatient clinics, automated electronic pathology reporting (e-path), diagnostic imaging, and death certificates. Data are coded according to uniform standards set forth by the North American Association of Central Cancer Registries (NAACCR). Information on tumor characteristics is collected for fields covering primary site, histology, cancer stage, cancer grade, laterality, extent of disease, and site-specific factors (e.g., breast cancer estrogen receptor status). Registries do not collect data on cancer risk factors such as hepatitis C virus (liver cancer), human papillomavirus (anogenital and oropharyngeal cancers), smoking, and alcohol use.
For analyses of cancer incidence, HACM studies use a modified version of the SEER site recode to categorize the cancer cases based on International Classification of Diseases (version 10) site codes and International Classification of Diseases for Oncology (version 3) histology codes. We typically categorize cancer cases with poorly specified histology codes separately, as these may represent misdiagnosed cases of Kaposi sarcoma or non-Hodgkin lymphoma. For some studies, we have categorized rectal squamous cell carcinomas separately from other rectal cancers, as these may represent misdiagnosed anal cancers (although some of these are true rectal cancers.12, 13 Similarly, we frequently restrict anal cancers to squamous cell carcinomas, as anal adenocarcinomas might be misdiagnosed rectal cancers. Kaposi sarcoma, some subtypes of non-Hodgkin lymphoma, and cervical cancer are considered AIDS-defining cancers by the CDC, but we try to analyze cancer sites separately rather than group them into AIDS-defining and non-AIDS-defining cancers. The size of the HACM Study makes us uniquely positioned to look at many different cancer types separately, without combining cancers into groups.
Information on first course of treatment is compiled from several fields for surgery, radiation, chemotherapy, hormone therapy, immunotherapy and transplantation. A challenge to using information on treatments derived from cancer registries is the lack of exact regimens, dose, and cycles for each modality. Furthermore, the completeness of cancer treatment information varies by registry and across calendar years. To address these limitations, epidemiologic analyses use summary variables that combine the individual components of first course cancer treatment.9, 10 In HACM Study analyses, 4 surgery variables, 3 radiation variables, and 1 chemotherapy variable contribute to the summary variables for each treatment modality (Table 3). For example, the summary variable for surgery is coded as “yes” (i.e., receipt of surgery) if any of the contributing surgery variables has a value indicating treatment; otherwise, if any surgery variable indicates no, then the summary variable is coded “no.” If all values are unknown or missing, then the summary variable is coded as unknown. Data on hormone therapy, immunotherapy and transplantation are also available for specific cancer types.
HACM studies examining trends and patterns in cancer treatment among PWH require preliminary examination of data completeness across years of registry coverage. Analytically, excessive missing information on treatment summary variables may be handled by excluding specific years of data according to a predetermined threshold. To illustrate, in Table 4, Michigan had >20% unknown values for each treatment summary variable during the years 1996-1998 which precludes analysis of treatment patterns and trends in Michigan during that time period.
| Name | Description | NAACCR Field |
|---|---|---|
| RX SUMM – SURG PRIM SITE | Codes for the type of surgery to the primary site performed as part of the first course of treatment. | 1290 |
| RX SUMM--SURG SITE 98-02 | Site-specific codes for the type of surgery to the primary site performed as part of the first course of treatment for tumors diagnosed before January 1, 2003. | 1646 |
| RX SUMM—SURGERY TYPE | Field for pre-1996 surgery codes for CoC and pre-1998 surgery codes for SEER. | 1640 |
| REASON FOR NO SURGERY | Records the reason that no surgery was performed on the primary site. | 1340 |
| RX SUMM—RADIATION | Codes for the type of radiation to the primary site performed as part of the first course of treatment. | 1360 |
| RAD—REGIONAL RX MODALITY | Records the dominant modality of radiation therapy used to deliver the clinically most significant regional dose to the primary volume of interest during the first course of treatment. | 1570 |
| REASON FOR NO RADIATION | Records the reason the patient did not receive radiation treatment. | 1430 |
| RX SUMM—CHEMO | Codes for chemotherapy given as part of the first course of treatment or the reason chemotherapy was not given. Includes treatment given at all facilities as part of the first course. | 1390 |
| RX SUMM—HORMONE | Records whether systemic hormonal agents were administered as first course therapy or the reasons they were not given. | 1400 |
| RX SUMM—BRM | Records whether immunotherapeutic (biologic response modifiers) agents were administered as first course treatment or the reasons they were not given. | 1410 |
| RX SUMM—TRANSPLANT | Identifies systemic therapeutic procedures administered as part of first course of treatment, including bone marrow transplants, stem cell harvests, surgical and/or radiation endocrine therapy. | 3250 |
| State | HIV/AIDS Cancer Match Study period | Exclusion of surgery information | Exclusion of radiation information | Exclusion of chemotherapy information |
|---|---|---|---|---|
| Colorado | 1998–2015 | |||
| Connecticut | 2002–2015 | |||
| District of Columbia | 2007–2015 | 2007 | ||
| Florida | 1997–2019 | |||
| Georgia | 2004–2012 | |||
| Louisiana | 1996–2015 | |||
| Maryland | 2008–2018 | |||
| Massachusetts | 2007–2016 | |||
| Michigan | 1996–2015 | 1996-1998 | 1996–1998 | 1996–1998 |
| New Jersey | 1996–2012 | |||
| New York | 2001–2019 | 2001–2002 | 2001–2002 | 2001–2012 |
| North Carolina | 1996–2014 | |||
| Puerto Rico | 2003–2017 | 2003–2017 | 2003–2017 | 2003–2017 |
| Texas | 1999–2015 | 1999–2002 |
Sensitivity and specificity of the registry linkages
HACM uses probabilistic linkage between HIV and cancer registries implemented with standard software that is commonly used to link surveillance databases. However, we recognize that the sensitivity of the linkage for ascertaining HIV status on cancer cases is imperfect. In the absence of a gold standard against which to validate matches, the sensitivity of the linkage between HIV and cancer registries in each jurisdiction is estimated by examining the proportion of Kaposi sarcoma cases in the cancer registry that matched to an HIV record in the 20-39-year-old age group. Kaposi sarcoma is very strongly linked to HIV-associated immunosuppression The assumption for the sensitivity calculation is that all Kaposi sarcoma cases in young age groups occur among PWH, as this cancer type is otherwise extremely rare. This assumption is supported by an examination of SEER-9 data during 1975-1977 (prior to the onset of the AIDS epidemic), during which only 3 cases occurred in this age range. As of 2023, the overall sensitivity among the HACM Study regions is estimated as 83.5%.
In studies where the number of incident cancers (i.e., burden) is calculated, we typically apply a sensitivity correction to account for the undercount of cancer cases who link to a PWH. To do this, in strata defined by characteristics of interest (e.g., sex, risk group, age, calendar year), we divide the number of cancer cases who linked to a PWH by the sensitivity of the linkage. This corrected value may not exceed the total number of cases in the corresponding strata in the general population of the cancer registry. When this approach is used, variance estimates should be calculated with either a closed formula or a bootstrap approach.14-16
Specificity of the linkages is estimated by comparing the proportions of breast, prostate, and colon cancers (three cancers not associated with HIV infection) that matched among the ≥70-year-old age group. The assumption for the specificity calculation is that nearly all cases of breast, prostate, and colon cancers in older age groups occur primarily among people who do not have HIV, as these cancers do not occur at an increased rate among people with HIV and the prevalence of HIV in the US population is extremely low. As of 2023, the estimated specificity among 13 HACM Study regions was 99.9%–100%.
Residency and migration
Cancer registry data capture cancers that occur in residents of the region at the time of diagnosis. Therefore, it is important that PWH are only considered at risk of cancer while residing in the same region. For some regions, there is substantial cross-region migration for HIV diagnosis and care. For example, medical providers in Washington, D.C. are likely to serve patients from several regions, including bordering states Maryland and Virginia. As a result, HIV may be reported to the DC HIV surveillance system for individuals who are not residents. When a linkage is completed, we examine two residency variables provided by the HIV registry, indicating whether the individuals live in-state at the time of HIV diagnosis and at the time that current residency was last ascertained. In states with a high fraction of individuals with no record of in-state residency based on those two variables, we typically exclude those individuals from the HIV database. In DC, for example, including people with HIV who were out of region at both time points would inaccurately lead to SIRs that are notably lower than other regions, because person-time would be overestimated due to the inclusion of out of region residents with HIV.
A separate, but related issue is the migration of PWH out of region over time. We consider individuals to be at risk of cancer until they die, and registries regularly link to the National Death Index, so we can censor at death regardless of current region of residence. However, we do not have information about if and when PWH move out of region, so we may continue to count person-time for some PWH even when their cancer can no longer be ascertained. This issue leads to underestimation of cancer incidence in PWH. One approach for mitigating this bias is to censor or discount person-time after 10 years of follow up to minimize the impact. This approach can be used as a sensitivity analysis. Though we do not have information on cross-region migration specifically for PWH, 1.5% of adults in the US general population moved across state lines between 2018 and 2019.17
Strengths and limitations
The strengths of the HACM Study design include its large, well-enumerated study population in which to characterize trends and examine associations between HIV and a wide spectrum of both common and rare cancer subtypes. In contrast to clinical cohorts of PWH, the population-based design of the HACM Study provides information on all reported HIV and cancer diagnoses within each participating jurisdiction, regardless of insurance status, enrollment in clinical care, or receipt of care at a single institution.
The HACM Study is regularly updated with new data linkages and. A design goal is to include broad representation of the HIV population across the United States, including Southern states (which are home to a large proportion of the domestic HIV population) and California. However, limited staffing at local health departments and evolving laws pertaining to data sharing are ongoing challenges to enlarging the geographic representation within the study. Nonetheless, the HACM Study is broadly representative in terms of demographics compared to the HIV population of the United States.
We recognize that the findings from the HACM Study may impact public health interventions and policy (i.e., burden estimates). We are careful to frame the interpretation of our results cautiously, especially when the associations are modest. We employ statistical methods to assess the effect of potential bias and for indirect adjustment when there may be important unmeasured confounding factors. We encourage replication of our findings in other studies, although replication may be challenging because of the uniquely large size of the HACM Study and its broad coverage of the US HIV population. We also consider whether our results need to be re-weighted to the full population of people with HIV in the U.S. to provide national estimates.
Part 2. Statistical considerations encountered in the most common HACM Study designs
Follow-up time for cancer incidence
The HACM Study primarily focuses on cancer incidence, survival, and mortality during the modern antiretroviral therapy era, defined as 1996 through the present time. Therefore, follow-up time for cancer incidence starts at the latest of: 1/1/1996, HIV report date, start of name-based HIV registration, and start of cancer registry coverage. The rationale to use HIV report date instead of HIV diagnosis date is discussed in the preceding section HIV registry information.
As discussed in Registry data sources, the study period for each state is dictated by the years of overlapping coverage of name-based HIV registration and complete ascertainment of cancer cases by regional health departments (see Table 1). Follow-up ends at the earliest of death, end of cancer registry coverage, or age 85 years. We generally do not end follow-up at cancer diagnosis in calculating incidence rates and standardized incidence ratios (i.e., cancer cases continue to contribute to the denominator after a diagnosis). This calculation introduces an excess amount of person-time after a cancer diagnosis when a person may not be at risk of developing the same cancer again, but the excess is quite small and the approach is consistent with that used by cancer registries to simplify calculations. We use age 85 as the upper age limit as some individuals in our data are followed until well over age 100, which we believe may be artifactual due to missed capture by registries of a small proportion of deaths.
Follow-up time for cancer survival
HACM Study projects analyze overall and cancer-specific survival. Cancer recurrence is not collected by cancer registries, and therefore cannot be assessed in the HACM Study. Follow-up for survival analyses begins at the time of cancer diagnosis recorded by the cancer registry. Contemporary cancer registries routinely match to state vital records and to the National Death Index to ascertain vital status and cause of death from death certificates. We censor as presumed “alive” at the earliest of December 31 of the last year of registry coverage (which assumes reasonably complete follow-up through the end of that year), or the date at which person’s age equals 85 years. See Table 1 for years of available registry data.
Estimation of cancer risk
The HACM Study seeks to quantify cancer incidence in the HIV population relative to people without HIV. Since an HIV-uninfected group is not readily available, HACM studies use the cancer incidence occurring in the general population, which is almost entirely comprised of people without HIV. The general population cancer incidence rate is then used as the expected rate in a standardized incidence ratio (SIR), to approximate relative risk. These expected rates are typically derived from the general population cancer cases from participating cancer registries, along with census data for the size of the general population in these regions. The expected rates are further stratified by sex, age, race/ethnicity, and calendar year.
For certain cancers (e.g., Kaposi sarcoma, central nervous system lymphoma), the extremely strong association with HIV leads to a situation where a sizeable fraction of cases in the general population are among PWH. This high HIV prevalence biases the SIR towards the null.18 One approach to address this issue is to select a historical general population prior to the start of the HIV epidemic for the comparison group; we have typically used SEER cancer registry data prior to 1980. An alternative approach would be to correct the contemporaneous general population by subtracting the HIV-infected cancer cases from the comparison group based on the linkage. However, this approach would require largely complete ascertainment of cancer cases in PWH, which is not attainable due to the imperfect sensitivity of the linkage.
Temporal trends in cancer risk
HACM sites contribute data over varying calendar intervals. Many analyses compare cancer rates in people with HIV to expected rates from the general populations in the same regions, so variation across registries in the covered calendar intervals leads to a weighted average SIR across the entire calendar year period. However, for some analyses, especially for those that assess calendar trends, it is important to assess and adjust for any bias related to the different calendar years contributed by each registry. Trend analyses should be mindful of specific registries that might have notably different incidence rates or SIRs for particular cancers. We have used several approaches to examine and address biases in temporal trends. One approach is to statistically assess heterogeneity in trends over time before providing estimates that combine all regions together. Another is to carry out sensitivity analyses where registries are left out of the analysis one or several at a time to address whether any one registry is having undue influence on the estimates.19 We have also imputed data for calendar years with incomplete data16 or adjusted for region in models that assess temporal trends in rates.19
Analyses of survival and cancer mortality
Among PWH who have cancer, overall survival reflects a combination of deaths from HIV (e.g., AIDS-related complications), cancer, and other conditions. When we conduct analyses of cause-specific survival after a cancer diagnosis among PWH, we use data on the underlying cause of death obtained from the cancer registries. These data are from death certificates and are ascertained by cancer registries through linkages with state vital records and/or the National Death Index. Causes of death are sometimes inaccurate. For this reason, we consider deaths to be due to a specified cancer diagnosis if the cause of death matches or is close (e.g., death due to colorectal or anal cancer in a person with diagnosed with anal cancer). Alternatively, one can use a broader approach that considers a wider range of causes of death for each type of cancer.20
We have also assessed cancer-related mortality among the HIV population. We have used data on overall mortality among PWH and the observed associations between cancer and mortality to statistically apportion deaths and thereby estimate cancer-attributable mortality among PWH.21 In a similar way, we have estimated life-years lost to cancer.22 This statistical method does not rely on information on cause of death. Nonetheless, HIV registries ascertain causes of death in PWH using similar methods to those used by cancer registries, and we collect such data in the HACM Study. Thus, analyses of cause-specific mortality in the HIV population are possible.
Contributors
Eric A. Engels, M.D., M.P.H., Co-Principal Investigator
Meredith Shiels, Ph.D., M.H.S., Co-Principal Investigator
Marie-Josèphe Horner, Ph.D.
Qianlai Luo, Ph.D.
References
- Frisch M, Biggar RJ, Engels EA, et al. Association of cancer with AIDS-related immunosuppression in adults. JAMA 2001;285(13):1736-45.
- Goedert JJ, Cote TR, Virgo P, et al. Spectrum of AIDS-associated malignant disorders. Lancet 1998;351(9119):1833-9.
- Melbye M, Cote TR, Kessler L, et al. High incidence of anal cancer among AIDS patients. The AIDS/Cancer Working Group. Lancet 1994;343(8898):636-9.
- Robbins HA, Shiels MS, Pfeiffer RM, et al. Epidemiologic contributions to recent cancer trends among HIV-infected people in the United States. AIDS 2014;28(6):881-90.
- Hernandez-Ramirez RU, Shiels MS, Dubrow R, et al. Cancer risk in HIV-infected people in the USA from 1996 to 2012: A population-based, registry-linkage study. Lancet HIV 2017;4(11):e495-e504.
- Engels EA, Pfeiffer RM, Goedert JJ, et al. Trends in cancer risk among people with AIDS in the United States 1980-2002. AIDS 2006;20(12):1645-54.
- Shiels MS, Islam JY, Rosenberg PS, et al. Projected cancer incidence rates and burden of incident cancer cases in HIV-infected adults in the United States through 2030. Ann Intern Med 2018;168(12):866-873.
- Shiels MS, Pfeiffer RM, Gail MH, et al. Cancer burden in the HIV-infected population in the United States. J Natl Cancer Inst 2011;103(9):753-62.
- Suneja G, Shiels MS, Angulo R, et al. Cancer treatment disparities in HIV-infected individuals in the United States. J Clin Oncol 2014;32(22):2344-50.
- Suneja G, Shiels MS, Melville SK, et al. Disparities in the treatment and outcomes of lung cancer among HIV-infected individuals. AIDS 2013;27(3):459-68.
- Centers for Disease Control and Prevention. HIV Surveillance Report, 2018 (Updated); vol. 31. http://www.cdc.gov/hiv/library/reports/hiv-surveillance.html. Published May 2020. Accessed [13 Jan 2026].
- Coghill AE, Bellizzi AM, Lynch CF, et al. Pathology characterization and detection of human papillomavirus type 16 in rectal squamous cell carcinomas. Clin Gastroenterol Hepatol 2019;17(10):2129-2131.
- Coghill AE, Shiels MS, Rycroft RK, et al. Rectal squamous cell carcinoma in immunosuppressed populations: Is this a distinct entity from anal cancer? AIDS 2016;30(1):105-12.
- Shiels MS, Pfeiffer RM, Hall HI, et al. Proportions of Kaposi sarcoma, selected non-Hodgkin lymphomas, and cervical cancer in the United States occurring in persons with AIDS, 1980-2007. JAMA 2011;305(14):1450-9.
- Shiels MS, Pfeiffer RM, Chaturvedi AK, et al. Impact of the HIV epidemic on the incidence rates of anal cancer in the United States. J Natl Cancer Inst 2012;104(20):1591-8.
- Zhang ER, Pfeiffer RM, Austin A, et al. Impact of HIV on anal squamous cell carcinoma rates in the United States, 2001-2015. J Natl Cancer Inst 2022;114(9):1246-1252.
- U.S. Census Bureau. Geographic Mobility: 2018 to 2019. (https://www.census.gov/data/tables/2019/demo/geographic-mobility/cps-2019.html).
- Chaturvedi AK, Mbulaiteye SM, Engels EA. Underestimation of relative risks by standardized incidence ratios for AIDS-related cancers. Ann Epidemiol 2008;18(3):230-4.
- Peprah S, Engels EA, Horner MJ, et al. Kaposi sarcoma incidence, burden, and prevalence in United States people with HIV, 2000-2015. Cancer Epidemiol Biomarkers Prev 2021;30(9):1627-1633.
- Howlader N, Ries LA, Mariotto AB, et al. Improved estimates of cancer-specific survival rates from population-based data. J Natl Cancer Inst 2010;102(20):1584-98.
- Horner MJ, Shiels MS, Pfeiffer RM, et al. Deaths attributable to cancer in the US human immunodeficiency virus population during 2001-2015. Clin Infect Dis 2021;72(9):e224-e231.
- Luo Q, Pfeiffer RM, Noone AM, et al. Years of life lost to cancer among the United States HIV population, 2006-2015. AIDS 2022;36(9):1279-1286.