With Big Data Come Big Responsibilities
, by Elise Tookmanian, Ph.D.
Data science provides a powerful transdisciplinary approach to data stewardship and analysis that allows researchers to take full advantage of the increasing scale of epidemiological data. DCEG investigators are implementing this approach across the Division by building collaborative data platforms and software tools for large-scale epidemiological research.
What is Data Science?
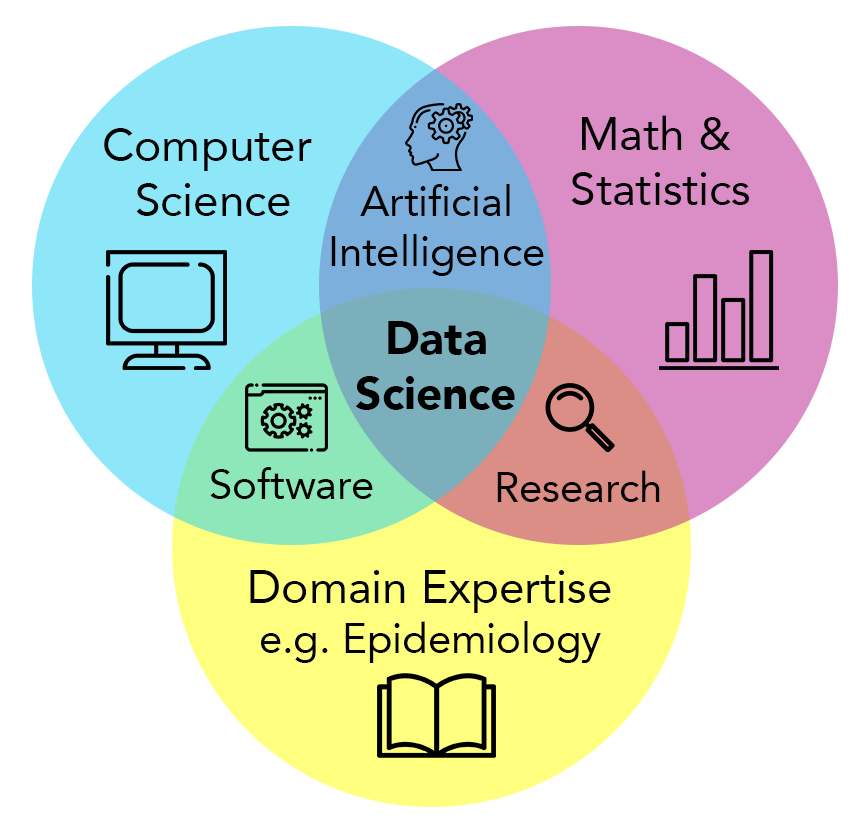
Epidemiologists have always known that more information (larger sample sizes, detailed medical records and exposure assessments, lifestyle information, or genomic data) can facilitate more precise characterization of health determinants. Today, they continue to push the envelope on acquiring and analyzing big data, through data science.
Data science concerns itself with the stewardship and analysis of data (especially “big” data). It is inherently transdisciplinary - the approach is useful across numerous fields of study. Bioinformatics is one field of data science, where the subject is biological data, from genomics to digital pathology to histology. DCEG data science centers around epidemiological studies, considering many data types generated in cohort studies to investigate cancer etiology and progression. The core data science approaches remain the same across domains, are facilitated by cloud computing resources, and rely on the fields of mathematics, statistics, and computer science, with a particular emphasis on the computational aspects of analyzing data distributed across different locations and governance frameworks.

NIH STRIDES Initiative
The NIH has made data science a priority through the NIH STRIDES initiative, which plays a critical role in facilitating storage and analysis of biomedical data at scale by providing cloud resources and supporting both extramural and intramural NIH researchers, like those within DCEG. The Division has also invested in data science through the Data Science & Engineering Research Group (DSERG), led by Chief Data Scientist, Jonas S. Almeida, Ph.D. DSERG lives within the Trans-Disciplinary Research Program (TDRP), which was established in early 2021 in response to the DCEG Strategic Plan. Staff in TDRP and DSERG work to increase cross-branch research initiatives and prevent the formation of silos between different research areas.
FAIR Principles
At its inception and as the field of data science grew, it became clear that guiding principles were needed to establish cohesion, especially for the stewardship of data. This led to the development of the Findable, Accessible, Interoperable, and Reusable (FAIR) Principles. DCEG is committed to applying FAIR principles in its research and to increasing FAIRness (i.e., adoption of FAIR principles) for new and existing tools and data repositories. “In DCEG, we want to be a resource for the greater research community and enable trans-divisional collaboration,” said Stephen J. Chanock, M.D., Director.
The “F” in FAIR stands for findable: knowing the location of a dataset, it can be easily found. Data storage has evolved from hand-written notes to punch-cards to floppy discs to files stored on hard drives. But these changes present a problem when migration from antiquated to newer formats leads to the loss of potentially useful data. Today’s data are moving to the digital cloud so they can be found reliably and accessed remotely via code or an application programming interface (API). Cloud-based storage also removes the risk of broken links due to poor website maintenance.
“We have more data than we can use, but right now, our code can’t find it,” said Dr. Almeida. To ensure findability, data should be assigned a permanent, unique location with its own URL, such as a digital object identifier (DOI). DOIs are most often associated with publications, but they can also be created for data sets, which increases their FAIRness.
The “A” stands for accessible. In this context, accessible means the data can stand on their own—both computers and humans should be able to read and understand it without additional help. There must be a standardized, open way to access the data without the need for proprietary applications. Using the standardized protocols of the web accomplishes this goal with the added benefit of tracking and controlling access. Additionally, the data should be linked to detailed information to help the user interpret it, called “metadata.” Metadata is especially crucial when pooling data sources or running another person’s code. “Accessibility is not necessarily opening up this data to anybody who is looking for it,” said Thomas U. Ahearn, Ph.D., M.P.H., staff scientist in TDRP. “It’s working within the governance framework of these studies so that people who should have access can get access.” Importantly, epidemiological data often includes sensitive health or personal-identifying information. To control access and maintain privacy, user authentication and authorization are part of a transparent data request process. The metadata and analysis tools, which do not include sensitive information, should always be publicly available even when the data are not.
The “I” stands for interoperable. Interoperability means computers can talk to other computers—to exchange and make use of information. Adopting this standard allows automated computer data processing to replace laborious and error-prone manual efforts. To make data and tools interoperable, they should be stored in non-proprietary file formats, such as CSV, and created using open-source code, such as R. Data stay in one place—the cloud—while computer systems and software access it, usually over the web (HTTP). The data files have become so large that downloading them to one place would be incredibly costly and inefficient. Additionally, having multiple copies that might be altered or processed differently can lead to mistakes or a loss of crucial information. While interoperability overlaps with accessibility, it is more concerned with establishing/utilizing a universal language for data representation to increase accessibility for computers and humans.
The “R” stands for reusable. Reusability allows a single data set to answer many different questions and enable many secondary uses. In this way, data become imminently more useful. Reusability is the culmination of the first three principles—it requires that the data are findable, accessible, and interoperable, with some additional guidance. Specifically, providing data usage licenses and detailed ownership information leads to appropriate assignment of credit and reuse. R is perhaps the most important principle in FAIR because the metric of reusability effectively assesses adherence to the preceding three standards.
FAIRness is a spectrum, and even small steps to increase FAIRness can have an impact. By following FAIR principles, research can become more reproducible as well as more equitable. FAIR principles level the playing field, “offering opportunities to a broad range of researchers by granting access to huge amounts of data, even if they don't necessarily have the same resources at their local institutions,” said Dr. Ahearn. “To put it simply, FAIR principles increase equity by making the data more broadly accessible."
Putting FAIR Principles to Use
The following are a selection of the activities taking place across the Division that put FAIR principles to use.
Working with Real-time Data in a Pandemic
COVID-19 Mortality Tracker
When the COVID-19 pandemic began and DCEG researchers pivoted to the emerging public health crisis, they were missing one important input: data. Prior to the pandemic, the Center for Disease Control and Prevention (CDC) would release death data when it was most complete and accurate, which usually takes about a year. “Because of the necessity of real-time public health data, the CDC started to release death data every week, with the acknowledgment that the more recent data are more incomplete,” said Meredith Shiels, Ph.D., M.H.S., senior investigator in the Infections and Immunoepidemiology Branch. However, the tables provided by the CDC were hard to interpret. For this reason, Dr. Almeida led a team of DCEG colleagues to create the COVID-19 Mortality Tracker, a web-based data visualization of the CDC data. Users can easily observe the number of deaths across the country and for individual states, even going deeper to look at different causes of death. “I remember at the beginning of the pandemic, it was really telling to be able to look, for example, at New York City and see the number of deaths that occurred. Comparing the third week in March of 2020 to the average of the prior five years revealed the magnitude of the pandemic,” said Dr. Shiels.
As the CDC continually revises their data, the visualizations automatically update. Dr. Shiels can quickly eyeball whether the data for specific states look complete at a certain time point before she begins a new analysis. “If I were doing it myself, it would be really tedious to assess the completeness of each state,” said Dr. Shiels.
Bringing Together Epidemiological Data to Improve Cancer Risk Assessments
While there are some genetic variations associated with dramatically high risk for breast cancer (i.e., BRCA1 BRCA2), most individual variants are associated with only small changes in risk. Researchers are developing polygenic risk scores, combining information on multiple variants to improve risk estimates: the more known variants, the more precise the risk estimates. However, to discover new genetic variants and validate the use of polygenic risk scores, epidemiologists need large, diverse cohorts and a lot of data. The Confluence Project is an ambitious research effort to bring together genomic data from 600,000 individuals of diverse ancestries. DCEG is building a data platform to facilitate data access and analyses in accordance with FAIR principles. “There have been previous papers that have combined data from multiple consortia, but it can be quite laborious,” said Montserrat García-Closas, M.D., Dr.P.H., Deputy Director and TDRP Director. “If the process for data access is not centralized, then data requests have to be sent to multiple places.” Within the Confluence Project, researchers will be able to submit a single request that will be directed to all relevant groups to access the combined data from 300 studies governed by five consortia. “We’re facilitating collaboration so researchers can have larger datasets and answer bigger questions,” said Dr. García-Closas.
Unfortunately, FAIR principles were not considered when these different data sets were first collected. “The later you start applying FAIR principles, the harder it is,” explained Dr. García-Closas. “Seamlessly using data from different sources requires the tedious process of data harmonization.” As new studies begin in DCEG, researchers are thinking about FAIR principles from the start to facilitate these future uses. “If you don't think about FAIRness in the beginning, it's easy to box yourself into a corner,” said Mia M. Gaudet, Ph.D., senior scientist in TDRP overseeing the Connect for Cancer Prevention Study.
Connect will further investigate the causes of cancer by following a prospective cohort of 200,000 adults who have never had cancer at the time of enrollment in the study. Participants will answer detailed questionnaires, provide access to their electronic health records, and provide biological samples. To collect and store this wealth of data, Dr. Almeida designed a data ecosystem in accordance with FAIR principles. Data are collected using a web interface, meticulously labeled, and stored in the cloud for later access through an API. “We’re creating tools using open-source code so that they can be utilized by other studies within DCEG or by the broader scientific community,” said Dr. Gaudet. “I hope a greater number of people utilize these data, leading to greater opportunity for scientific discovery.”
Incorporating New Tools: Artificial Intelligence
As data sets grow, analyses using AI algorithms have been developed to evaluate them rapidly and effectively—picking up on details and patterns humans might never perceive. For example, to improve cervical cancer screening in low-resource settings, investigators explored the use of deep learning neural networks to evaluate a picture of a cervix for signs of precancer. In order to succeed, the AI needs to train on thousands of images labeled by expert clinicians as either precancer or not precancer. By training on these images, the algorithm is learning what features are important, what is predictive in determining if an image is labeled “precancer” or “no precancer.” The algorithm “looks at every feature of the data,” said Mark Schiffman, M.D., M.P.H., senior investigator in the Clinical Genetics Branch. “The pixels of the image have more information than a human can physically process. The algorithm can get extremely good at this categorization.” However, once trained, the algorithm still needs to be tested on another completely different data set to ensure broad applicability.
These algorithms are becoming commonplace and available as open-source code. They can be picked “off the shelf” and applied to any problem—given enough accurate data. “As more data become available, they become unreasonably effective—we can model a process based on analysis of the underlying signals. This allows for preemptive falsification of null hypotheses, which reveals the predictive factors for statistical modeling,” said Dr. Almeida. AI is one data analysis tool that excels at this task.
Support and Training
While data science and FAIR principles are promising components of the future of epidemiological research, appropriate implementation requires significant investment. DCEG is committed to rewarding researchers for their data science efforts, especially data and code sharing, with recruitment, promotion, and monetary support. These incentives require detailed information on data or code governance and how to cite them – the “R” in FAIR principles.

Fellows talk in small groups in the NCI Shady Grove Campus atrium.
TDRP has invested in organizational support for data science through DSERG, which offers DCEG investigators consultation and collaboration with data scientists as well as training for the current and next generation of epidemiologists. Plans are underway to launch a Virtual Bioinformatics Core, which will provide training and support for the development of FAIR pipelines in the Cloud. “Data science is a new scope for education,” said Dr. Almeida. “It is another layer of literacy that is needed for scientists.” He is involved in training efforts both within DCEG and across the NCI and hosts the weekly Cloud4Bio hackathon, which brings together people interested in data science to solve problems together. But trainees are not the only ones who are learning. “I am lucky to learn so much from my students,” Dr. Almeida says. The next generation of epidemiologists is here, and data science methods are important tools in their toolbox.