Retrospective on the Informatics Tool Challenge: Driving Innovation and Creativity at DCEG
, by Justine E. Yu
The Informatics Tool Challenge has driven innovation and creativity by providing a supplementary funding source for DCEG researchers seeking to create novel tools to enhance data collection, analysis, and other avenues of investigation in the fields of epidemiology and genetics.
Sparking Novel Approaches to Informatics

Innovative research methods are one of the hallmarks of DCEG research. From its inception, researchers have utilized information technologies to advance the fields of epidemiology and genetics in the pursuit of the Division’s mission to discover the causes of cancer and the means of prevention—from the generation of cancer maps, to the use of random-digit dialing for study recruitment, to the development of new approaches to big data science. In 2014, then newly appointed Director Stephen J. Chanock, M.D., launched the Informatics Tool Challenge as a competitive funding source for DCEG researchers seeking to create novel tools to enhance data collection, analysis, and other avenues of investigation.
“The challenge has encouraged diverse and creative ideas which continue to push the limits of our modern technological and informatics environment,” said Dr. Chanock. “Proposals are evaluated for their novel approach to specific research needs, the ability for the project to be completed within one year of initiation, and cost, not to exceed $20,000. Reviewers consider technical feasibility, utility to epidemiologic and genetic research and alignment with the Division’s mission.”
The Informatics Tool Challenge provides a unique, supplementary funding source for investigators, staff, and fellows whose ideas are not tied to a specific research study. Multiple collaborations across the NCI and NIH as well as external institutions, have blossomed as a result of the Challenge.
With the seventh call for applications approaching, Dr. Chanock reflected on its evolution, “DCEG is home to some of the world’s leading epidemiologists and geneticists who are focused on understanding and characterizing the etiology of cancer. To date, the Informatics Tool Challenge has given 37 awards with applications from all the Division branches. I look forward to continuing to promote a culture of innovation and collaboration across the Division.”
The following is a sampling of tools that illustrate the growth and success of the Informatics Tool Challenge.
Study Design and Analysis Tools
LDlink
A web-based tool that interactively explores linkage disequilibrium across population groups from the 1000 Genomes project.
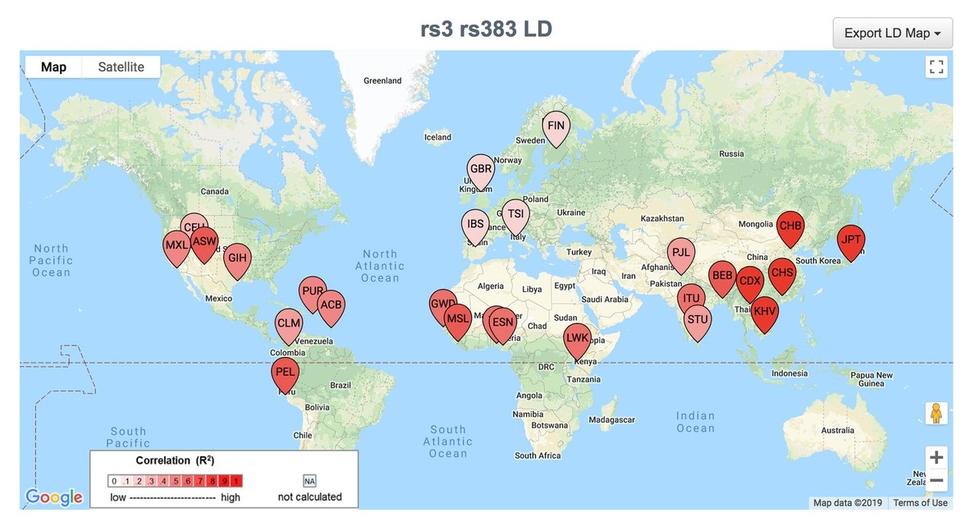
LDpop plots linkage disequilibrium by ancestry or geographic location.
Identifying Alleles Commonly Inherited Together
Many DCEG investigators seek to identify functional disease variants from identified risk loci of genome-wide association studies. Linkage disequilibrium (LD) refers to the non-random association of alleles at different loci in a population. Though several tools were in use to aid the selection of single nucleotide polymorphism (SNP) markers for highly correlated regions of LD in the human genome, there was a need to determine alleles commonly inherited together when two SNPs are in high LD. Mitchell Machiela, Sc.D., M.P.H., Earl Stadtman tenure-track investigator in the Integrative Tumor Epidemiology Branch, developed LDlink, a web-based tool which interactively explores LD across population groups from the 1000 Genomes Project.
Milestones of Success
Dr. Machiela submitted the proposal for LDlink during his postdoctoral fellowship; it was one of the first projects to receive funding through the Challenge. In the years following, Dr. Machiela has succeeded in gaining additional funding to improve the tool with postdoctoral fellow Shu-Hong Lin, Ph.D., M.S., at the request of its growing user base. “LDlink was originally intended to be a simple online reference for lab biologists and has surpassed our expectations,” said Dr. Machiela.
Currently in its third version, LDlink features new user options which add to the functionality; the SNPclip module filters variants according to a user-defined LD threshold, the LDassoc module enables interactive visualization of LD by uploading GWAS association results and the new LDpop module allows for easy investigation of differences in LD patterns across ancestral populations by utilizing the Google Maps application programming interface. Other functions that add to LDlink’s versatility include the ability to link data with external resources such as the UCSC Genome Browser as well as a new API to access LDlink through the command line or in R using the recently developed LDlinkR library. To date, LDlink has been widely used by investigators at the NCI and around the world, accruing over 75,000 users in 146 countries; it has been featured in the AACR Integrative Molecular Epidemiology summer workshop since 2017. LDlink will soon launch a website redesign and a new module, LDtrait, that will allow users to investigate phenotype associations in LD.
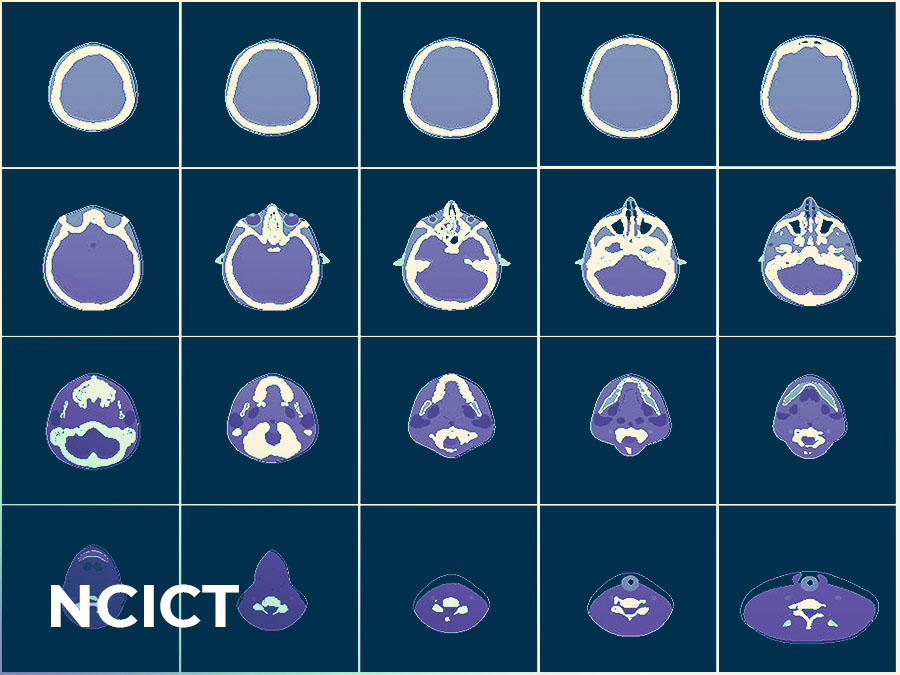
National Cancer Institute dosimetry system for Computer Tomography (NCICT)
A web-based calculator that measures the dose of radiation received by patients undergoing diagnostic or therapeutic CT exams.
Measuring Radiation Exposure from CT exams
Over the last 30 years, the number of computed tomography (CT) examinations in the U.S. has grown exponentially. Approximately 10 percent of all CT examinations are performed on pediatric patients, who are at a higher risk of radiation-related cancer compared to adults. Ongoing work in the Radiation Epidemiology Branch (REB) focuses on understanding the health risks associated with ionizing radiation exposure. Reliable quantification tools are essential to estimate radiation dose from medical exposures. Choonsik Lee, Ph.D., senior investigator in REB and head of the Dosimetry Unit, created the NCI dosimetry system for Computer Tomography (NCICT) based on Monte Carlo simulations and computational human phantoms to estimate the organ doses received by patients undergoing diagnostic or therapeutic CT exams.
Milestones of Success
NCICT was originally developed to be a computer program running on a Windows Operating System, which limited widespread use. The Informatics Tool Challenge award allowed Dr. Lee to move the tool to multiple Operating Systems including Mac, Linux, and the web, as well as develop a software release portal, which increased accessibility and awareness about the software. “Since its multi-platform transition, NCICT’s usage has expanded to hundreds worldwide and resulted in a licensing agreement with a medical software development company, PACSHealth, and dozens of research publications,” said Dr. Lee.
Prevalence Incidence Mixture Models (PIMixture)
A tool that estimates absolute and relative risk for screen-detected cancer and cancer precursors.
Measuring absolute and relative risk
Epidemiologic researchers are beginning to utilize the vast resource of observational data extracted from electronic medical records. While this approach could prove cost-effective and efficient, it may also present challenges for analysis. For instance, in studies of screen-detected disease, prevalent disease is not always immediately diagnosed because people with missing, negative, or borderline screening test results generally do not undergo additional surveillance and testing, such as biopsies. In addition, irregular clinical visits prevent precise timing of disease incidence, resulting in a mixture of truly incident and undiagnosed prevalent disease. Ignoring these complexities may introduce bias that could result in under or over estimates of risk.
Investigators in the Biostatistics Branch (BB), Noorie Hyun, Ph.D., former fellow, Li C. Cheung, Ph.D., staff scientist, and Hormuzd A. Katki, Ph.D., senior investigator, as well as Mark Schiffman, M.D., M.P.H., senior investigator in the Clinical Genetics Branch, created the Prevalence-Incidence Mixture Models (PIMixture) tool to address the need for absolute and relative risk estimation for screen-detected cancer and cancer precursors.
Milestones of Success
Since its launch, PIMixture has been used to provide evidence for the interim clinical guidelines for primary HPV screening and the basis of risk-based management guidelines for cervical cancer. PIMixture can be scaled easily to support analyses of studies based in integrated healthcare systems, such as the new DCEG cohort, Connect for Cancer Prevention.
Standardized Occupation Coding for Computer-assisted Epidemiologic Research (SOCcer)
A software that codes occupations based on self-reported job descriptions.
Standardizing Occupation Classification Codes
An ongoing challenge in large-scale epidemiological studies is the processing and use of occupational exposure data, which is the first step in identifying work-place exposures that may contribute to cancer risk. Typically study participants provide details in free-text responses to open-ended questions about their job title, employer, and work tasks. Standardizing these job descriptions is a crucial step to identifying occupational-related exposures, but manual coding is time-consuming and expensive.
Melissa Friesen, Ph.D., senior investigator in the Occupational and Environmental Epidemiology Branch, and Daniel E. Russ, Ph.D., formerly of the NIH Center for Information Technology and now a staff scientist in the DCEG Data Science Group, developed Standardized Occupation Coding for Computer-assisted Epidemiologic Research (SOCcer) to help epidemiological researchers incorporate occupational risk into their studies more easily. The publicly available software uses an algorithm to identify, classify, and code occupations based on reported job descriptions, and assigns a score that assesses the probability of the code matching an expert coder’s assignment. Evaluation of the algorithm in two case studies found that it reliably replicated manually assigned occupation codes; SOCcer’s assignments had overall agreement with expert coders that ranged from 45 percent at the most detailed level of the classification system and 76 percent at a major grouping level. Its agreement with manual coding increased with algorithm score; low scoring job descriptions are more likely to require expert review than high scoring job description. “The application is unique in its ability to code job classification from several components of a job description. Reducing the resources needed to code jobs is a crucial first step in being able to account for the workplace exposures of study participants,” said Dr. Friesen.
Milestones of Success
Funds awarded from the Informatics Tool Challenge in 2015, 2016, and 2017 supported the development of SOCcer 2.0, which enhanced the algorithm by using an expanded training data set and improved the software’s ability to assign the correct code by 5 percent. In addition, the companion software SOCAssign, was developed to assist expert coders in reconciling poor computer-based matches by focusing on a subset of job descriptions (i.e. ones that have two codes tied for highest score or that had low scores). Furthermore, the extension “SOCcer in the Field” improved data collection by allowing study participants to code their own job descriptions in a web-based questionnaire.
SOCcer has supported intramural and extramural occupational epidemiological research, including ongoing work in the Early Life Exposures in Agriculture Study, and has encouraged researchers to develop similar coding algorithms for their own classification systems internationally.
COMETS Analytics
A web-based tool that helps streamline and standardize the meta-analysis of data from metabolomics consortia.
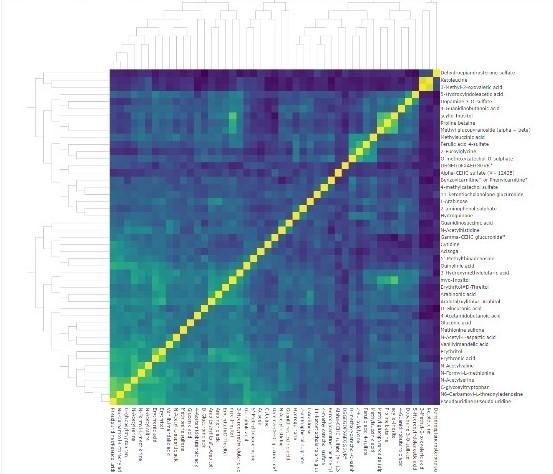
Hierarchical clustering heat-map of metabolites related to age in sample file of COMETS Analytics.
Standardizing the Meta-Analysis of Metabolomics Data
Recent advances in metabolomics—the study of small molecule constituents of a biological system—have made it possible to study human physiology and metabolism in unprecedented detail. To take advantage of these advances, intramural and extramural epidemiologists have joined forces to form the COnsortium of METabolomics Studies (COMETS), composed of 65 international prospective cohorts with blood-based metabolomics data and follow-up for disease outcomes. Steven C. Moore, Ph.D., M.P.H., Earl Stadtman tenure-track investigator in the Metabolic Epidemiology Branch, served as the founding Chair of COMETS.
COMETS presents opportunities for epidemiologists but the analysis of consortium data remains complex, with best practices still under development. COMETS Analytics is an online application that streamlines and standardizes the analysis of metabolomics data and facilitates the conduct of large-scale meta-analyses. It was developed as a collaboration between Dr. Moore, researchers from George Washington University and Ohio State University, and was co-funded by the Division of Cancer Control and Populations Sciences. COMETS Analytics standardizes the process of developing data inputs and models, automatically handles modeling issues, and outputs results in a format ready for meta-analysis.
Milestones of Success
COMETS Analytics has been used to analyze the association of age and body mass index with metabolite levels in 45 different cohort studies that together comprise more than 110,000 research participants. Meta-analyses of these results are underway with publication anticipated over the next year. This large-scale real-world test demonstrated that COMETS Analytics can operate with complex and heterogeneous datasets and performs well under conditions of high processing loads.
Health Information and Risk Assessment Tools
Risk-based NLST Outcomes Tool (RNOT)
A web-based comprehensive lung cancer risk tool that combines multiple risk models to inform researchers of an individual’s risk of lung cancer and screening.
Assessing risk for lung cancer screening
In 2011, the National Lung Screening Trial (NLST) demonstrated that three annual rounds of computed tomography (CT) lung screening reduced lung cancer death in heavy smokers by 20%. As a result, the US Preventive Services Task Force recommends CT lung screening for smokers age 55-80 who currently smoke or have quit within the past 15 years and have a 30 pack-year history of cigarette smoking.
Recent studies by Li C. Cheung, Ph.D., staff scientist and Dr. Katki, senior investigator, both in BB, and Anil Chaturvedi, Ph.D., senior investigator in the Clinical Epidemiology Unit of the Clinical Genetics Branch, found that both risk-based and life-gained-based strategies may prevent more lung cancer deaths and result in greater gains to life expectancy, compared to current US Preventive Services Task Force guidelines. Using funds from the Informatics Tool Challenge, they created the Risk-based NLST Outcomes Tool (RNOT) for researchers to accurately predict an individual smoker’s risk of lung cancer, their risk of mortality from lung cancer, and whether the individual would benefit from lung cancer screening.
Milestones of Success
RNOT was the first comprehensive lung cancer risk tool to combine multiple risk models to inform researchers of an individual’s risk of lung cancer and screening. Currently, Drs. Cheung, Katki, and Chaturvedi are working to incorporate their latest model, Life Years Gained from Screening-CT, which estimates the years of life gained from screening, using funds awarded from the 2019 Challenge. Using the individualized life-years gained strategy is an attractive alternative to the current individualized risk models because it also accounts for a patient’s life-expectancy, and thus their overall health, improving the benefit versus harms trade-offs of those referred to screening.
Moles to Melanoma: Recognizing the ABCDE
Annotated photographs of pigmented skin lesions overtime to aid in the recognition of normal moles, dysplastic nevi, and melanoma.
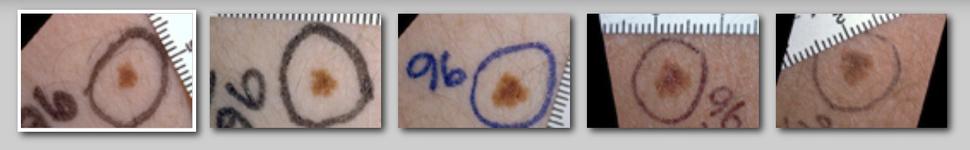
Case series of a dysplastic nevus that changed in ways suspicious for melanoma.
Identifying benign and malignant skin lesions in case series
For over 40 years, Margaret Tucker, M.D., scientist emerita, and collaborators, studied individuals and families enrolled in the NCI Familial Melanoma Study, and documented skin changes. They indexed hundreds of clinical photographs into the online tool, Moles to Melanoma, to create a public resource to help patients, healthcare workers, and the general public, recognize dysplastic nevi, important risk markers and precursor lesions for melanoma, and melanomas arising from dysplastic nevi.
Geoffrey Tobias and Mary Fraser, R.N., M.A., organized and annotated the collection of photographs of individual pigmented lesions, presenting 29 case series documenting changes in these lesions over time and across various mole changes typically seen in individuals from U.S. melanoma-prone families.
Milestones to Success
The Informatics Tool Challenge provided financial support to create the web tool which included a mobile-responsive design and 508-compliant interface. Since its development, the website averages 19,000 unique visitors a year; usage is highest during the summer.